2016 may very well be the year of the underdog.
It was for the Cleveland Cavaliers, who were down 1 to 3 to the Golden State Warriors, but came back to win game seven of the NBA Finals.
It was for the Chicago Cubs, who were one game away from extending a 109-year World Series championship curse, until they won three games in a row to clinch the World Series Champion title against the Cleveland Indians.
And it was for Donald Trump, who won the election despite state and national reports based on public opinion polls suggesting Hillary Clinton would be the next president.
“The chances of Trump winning the election were actually greater than the Warriors losing to the Cavaliers last year, or the Cubs coming back from a 3 to 1 standing,” says University of Texas at Austin government professor Daron Shaw. “But if you asked me what surprised me more, I probably would have said Trump winning the election. And that’s a little bit on us and a little bit on the media.”
While the election results surprised many, pollsters at UT Austin say a second look at the data reveals other stories about the electorate that are, in some ways, more telling. So, we asked the pollsters behind the UT/Texas Tribune Poll: Why didn’t the 2016 election polls fail? Here are seven observations gleaned from their answers.
1. The national polls predicted that Clinton would win the popular vote. She did.
The average of polls conducted during the week before the election had Hillary Clinton ahead by 3 points. She won the popular vote by 1.6 points. “Hillary Clinton was basically at 47 or 48 percent in the polls, that’s what she got. What she didn’t do was pick up many of the undecided or third party voters who shook loose late in the election cycle,” Shaw says.
2. The polls were off only slightly more than average.
The difference between the national polling average and actual election results in the 2016 election was about 1.6 percentage points, which is slightly below the historic average of 2 points difference in the last 16 presidential elections, according to the pollsters. In 2012, the difference between the national polls conducted in the final week and the actual result was 2.7 points.
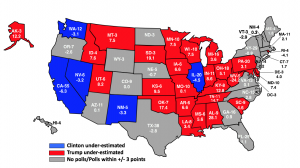
The states with the largest mispredictions were strong-red states, such as Tennessee (14.7 points off), Oklahoma (17.4 points off), South Dakota (19.1 points off), West Virginia (24.2 points off), and Alabama (28.1 points off). The polling errors in major battleground states were much smaller, about 2.7 percentage points, though these errors were more consequential, Shaw says.

3. Some of the polling error was because most of the late movement benefitted Trump.
According to exit polls, 49 percent of those deciding in the last week of the election voted for Trump compared to Clinton’s 42 percent. This “movement” could be due partly to dwindling support for third-party candidates, who lost a third of their support in the last two weeks, the pollsters say.

Given this, what can we say about the possibility that FBI Director James Comey’s decision to reopen the investigation into Clinton’s email scandal influenced the end results?
“In terms of Republicans ‘coming home,’ it’s hard to disentangle how much reflects the nature of the campaign and predictable movement among Republicans, and how much was at least helped by the Comey announcement reminding people, especially Republicans, how much they didn’t want Hillary Clinton to be president,” says Joshua Blank, manager of polling and research at the Texas Politics Project. “For Democrats who are looking to cast blame on Comey, you can for various reasons,” Blank says. “But the reality is he reinforced what was already going on. He didn’t create the dynamic. Clinton’s scandal was baked into the cake for a long time.”
4. The consistency of the national polls, coupled with the corroborating story suggested by the statewide polls, led to over-confidence that Clinton was winning in the Electoral College.
The pollsters say that despite the small margin in the national polls and in many key states, the polls were still interpreted as if Clinton was dominant. This perspective turned a blind eye to the lack of enthusiasm and uneven turnout history from many of Clinton’s core supporters.
“One thing I would add to defend the pollsters is that there’s a difference between people who conduct polls and poll aggregators,” Blank says. “What’s fueling this somewhat false impression about how devastated the whole polling industry is, is the fact that other people took this information and interpreted it in such a way to say ‘we’re 98 percent sure that this is the outcome we’re going to get.’ Nobody that is actually collecting this data went that far.”
“There was some group think among even ourselves,” says Texas Politics Project director James Henson. “We looked at six or seven models all of which said that Hillary Clinton is somewhere between 65 and 90 percent likely to win, and we all went ‘well, she’s probably going to win.’”
5. We ignored some of the key implications of our own data.

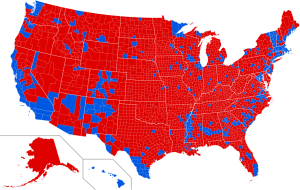
According to Shaw, “The polls told a consistent story throughout the entire election: The enthusiasm for Hillary Clinton from core elements of the Obama coalition was underwhelming. She was underperforming with African Americans and millennials, while Trump was over performing with non-college-educated whites, increasing Romney’s vote marginally in rural and ex-urban counties. Hillary’s campaign died the death by a thousand cuts; small increases in lots of counties. That is the story of the election. It looked in the aggregate like it wasn’t enough to alter the outcome and, in fact, it was.”
6. The point estimates from polls are at least as instructive as the margin.
The pollsters agree, public support for Clinton reflected that of an incumbent candidate, likely due to her previous positions as U.S. Secretary of State and First Lady that left her in the forefront of the public eye.
“There is an axiom in survey research that if an incumbent candidate is not over 50 percent in the pre-election polling, you’ve got some trouble,” Shaw says. “The supposition is that people who have not made up their minds or committed by late October have actually decided they’re not voting for the incumbent. I think in this election Hillary Clinton was basically the incumbent, and she very rarely broke 50 percent, even in the two-way ballot questions. And she ended up getting exactly what she polled: 48 percent.”
7. More high quality polling is needed in secondary battleground states.
“The lack of solid statewide polling led us to believe that Trump didn’t have many paths,” Shaw says. “As it turned out, he had more paths than we thought and that became evident on election night as the actual data came in.”
One issue in 2016, the pollsters say, is that some places (particularly in the upper-mid west) were simply under polled. Though Trump had growing support among white, blue collar, non-college-educated people, no one thought it was enough to make him competitive in Wisconsin, Michigan or Minnesota. As a result, polling organizations conducted surveys in more obvious battleground states, such as Florida, North Carolina and New Hampshire.
Simple economics can explain polling limitations. “State polling really is kind of a function of business and markets in a lot of ways,” Henson says. “The players at the state level interested in running these polls want to know about opinions in their local media markets. News media organizations have limited budgets for statewide polls, so whether or not a state is polled often depends on the actors and context that exist in a more localized context. Without a hot-button local issue or a deep-pocketed interest group, many of these states will be under-polled.”
